Loading...
Turnkey Intermediate Package
ATM Trading Software
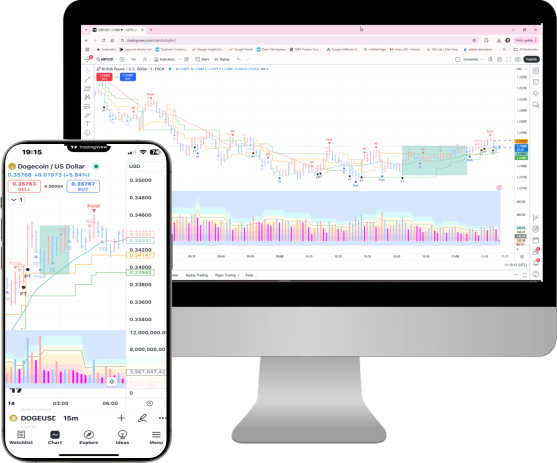
The ATM Trading software plugs into the TradingView platform, and works with any TradingView subscription, including the free one.
There are 2 indicators:
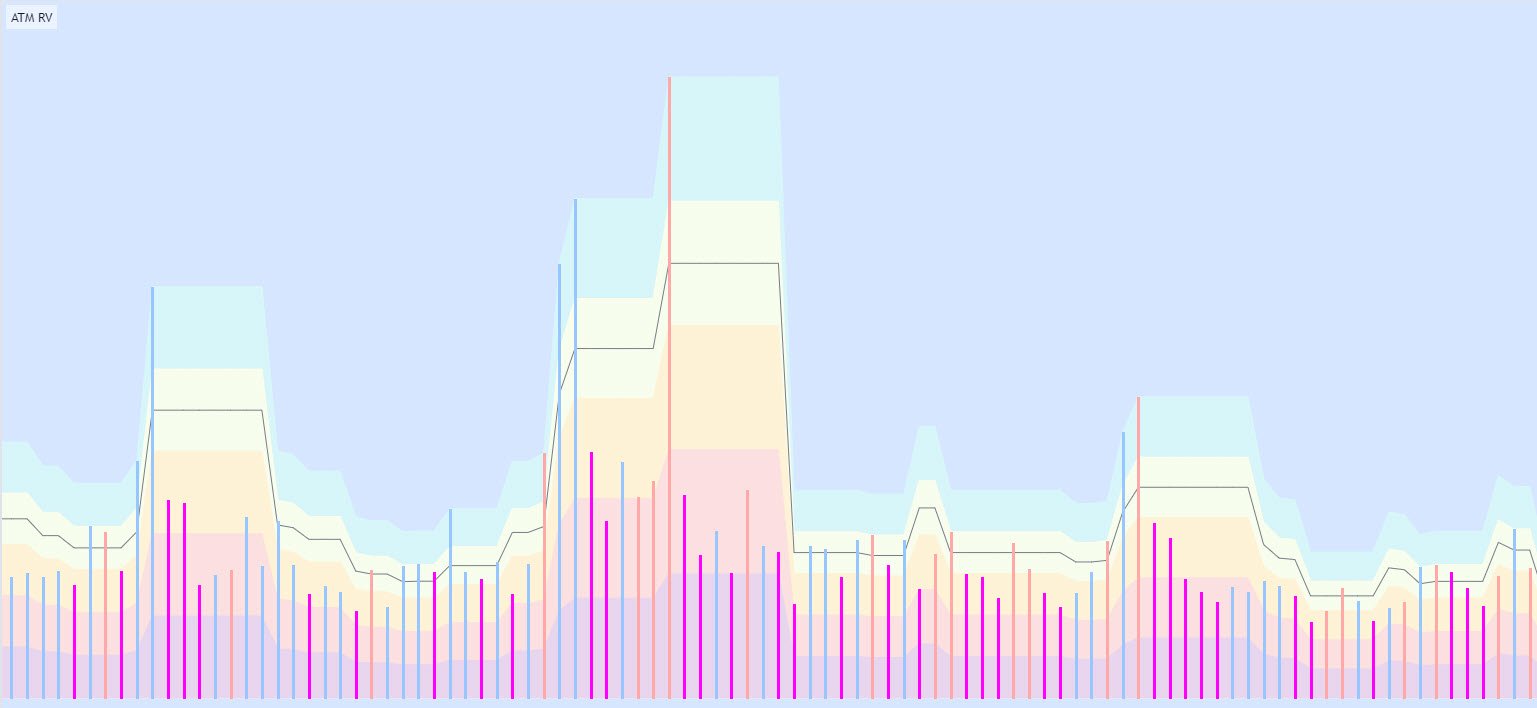
The ATM VSA Indicator
The ATM Relative Volume Indicator
This powerful software toolset, is used to power the company’s Live Trading Room and the copy trading service.
The software will help you:
Identify trade setups
Enter trades
Manage trades
Identify optimal exit points
The software can provide email notifications to let you know when a trade setup has been identified, so you are not tied to the trading desk.

Turnkey Intermediate Trading Course
The Turnkey trading course is modular, and can be accessed at your own pace, on PC, laptop, tablet, or smartphone.
The course has 8 different modules covering 3 main aspects.
Volume, VSA Principles, Wyckoff Market Cycle, Multiple timeframe trading
The ATM VSA, ATM Relative Volume, other software tools, SWIFT
Putting it all together, Trading Examples
Each module is interactive and uses AI, to evaluate your understanding, to ensure you retain as much of the knowledge as possible. This accelerates learning.
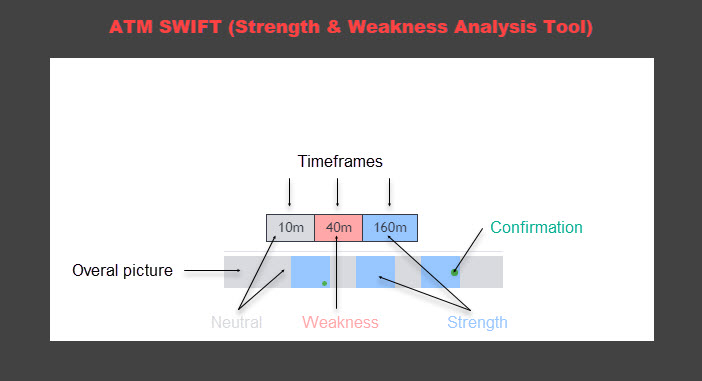
ATM SWIFT Indicator
One of the main challenges traders have is to look for trading candidates. For each instrument in question this process requires analysis of several charts, searching for specific patterns, finding corresponding confirmation signals, and calculating risk/reward. It is difficult and time-consuming. Using Volume Spread Analysis which requires a deep study of strength/weakness, adds more challenges. The ATM Strength & Weakness Analysis Tool, or ATM SWIFT indicator as it's also known, helps traders address such issues and saves a lot of time in the trade preparation phase.
The tool does the following:
Looks at 3 timeframes simultaneously
Analyses strength/weakness in each timeframe independently
Displays current snapshot of strength/weakness for each timeframe
Provides overall strength/weaknes of the instrument
Searches, displays and alerts for the VSA confirmation signals
Quarterly subscription
- Includes access to the Turnkey Course
- Access to the ATM Trader software
- Includes full technical support
Want to add the Live Trading Room for an extra €240?
Quarterly subscription
- Includes access to the Turnkey Intermediate Course
- Access to the ATM Trader software
- Access to the SWIFT indicator
- Includes full technical support
Want to add the Live Trading Room for an extra €240?
Quarterly subscription
- Includes access to the Turnkey Advanced Course
- Access to the ATM Trader software
- Access to the SWIFT indicator
- Access to the Bar Verification indicator
- Includes full technical support